Decide on an MBE strategy you want to investigate. Then decide what your outcome measure will be. In all the research plans in this decision tree, one group will receive your MBE intervention (=MBE) and one group will receive 'treatment as usual'/'teaching as usual' (=TAU).
Created by Beth Morling, University of Delaware, Kristin Gagnier, Johns Hopkins University, and Ian Kelleher (CTTL).
Consider Research Plan 4: Use the MBE intervention with some units and treatment as usual (TAU) with other units throughout the year. Ideally you would randomly select which units get the MBE intervention and which get treatment as usual (for example, by going through your syllabus unit by unit and tossing a coin). Depending on your course, though, we realize that this might not be possible. You may have to choose a selection of your units and do the random coin-toss assigning on just those. Or, as a last resort, choose which get the MBE and which get TAU.
Your data
may look like this:
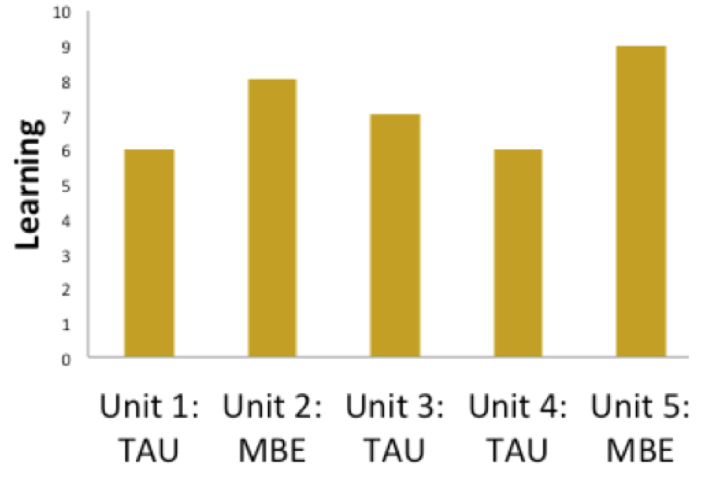
<>
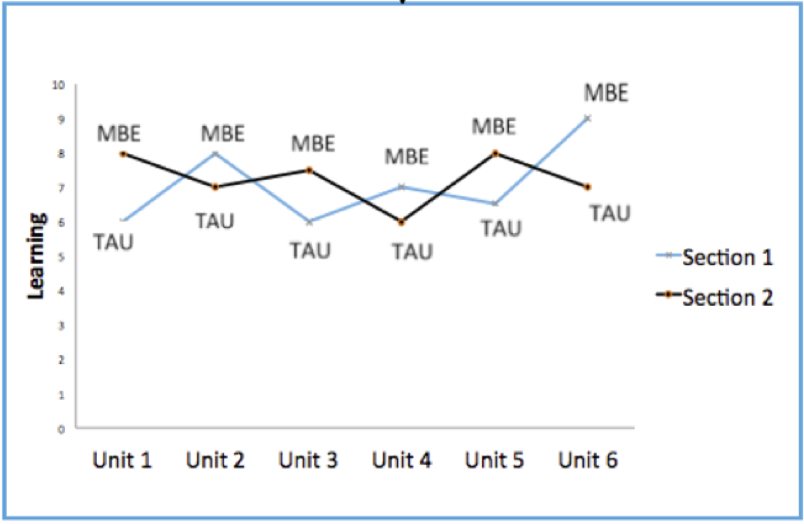
Consider Research Plan 5: Alternate, unit by unit, which section gets the MBE intervention and which gets treatment as usual (TAU). Take measurements for both sections for every unit. If the MBE intervention is working, then the section that got the MBE intervention on that unit will score 'higher' than the section that got TAU. So, when you look at your results you should see your two sections keep trading places -which is higher, which is lower- from unit to unit.
Your final data may look like this: